eSource Technology for Sites, Sponsors, and CROs
Sites need to produce accurate, actionable data, but how can they focus on quality when bogged down with administrative tasks? To keep trials on track, you need superior at-the-source data collection, streamlined workflows, and real-time visibility that lighten site burden while driving protocol compliance. You need the best eSource in clinical trials — which is clearly CRIO.
CRIO is the only eSource platform with central and local site offerings tailored to sponsors, contract research organizations (CROs), and sites.
Central eSource™: The Only eSource in Clinical Trials for Sponsors and CROs
The first-of-its-kind Central eSource solution, CRIO allows sponsors and CROs to leverage the benefits of the eSource tool already preferred by sites.
Site eSource: The Preferred eSource Platform for Sites, Site Networks, and Academic Medical Centers
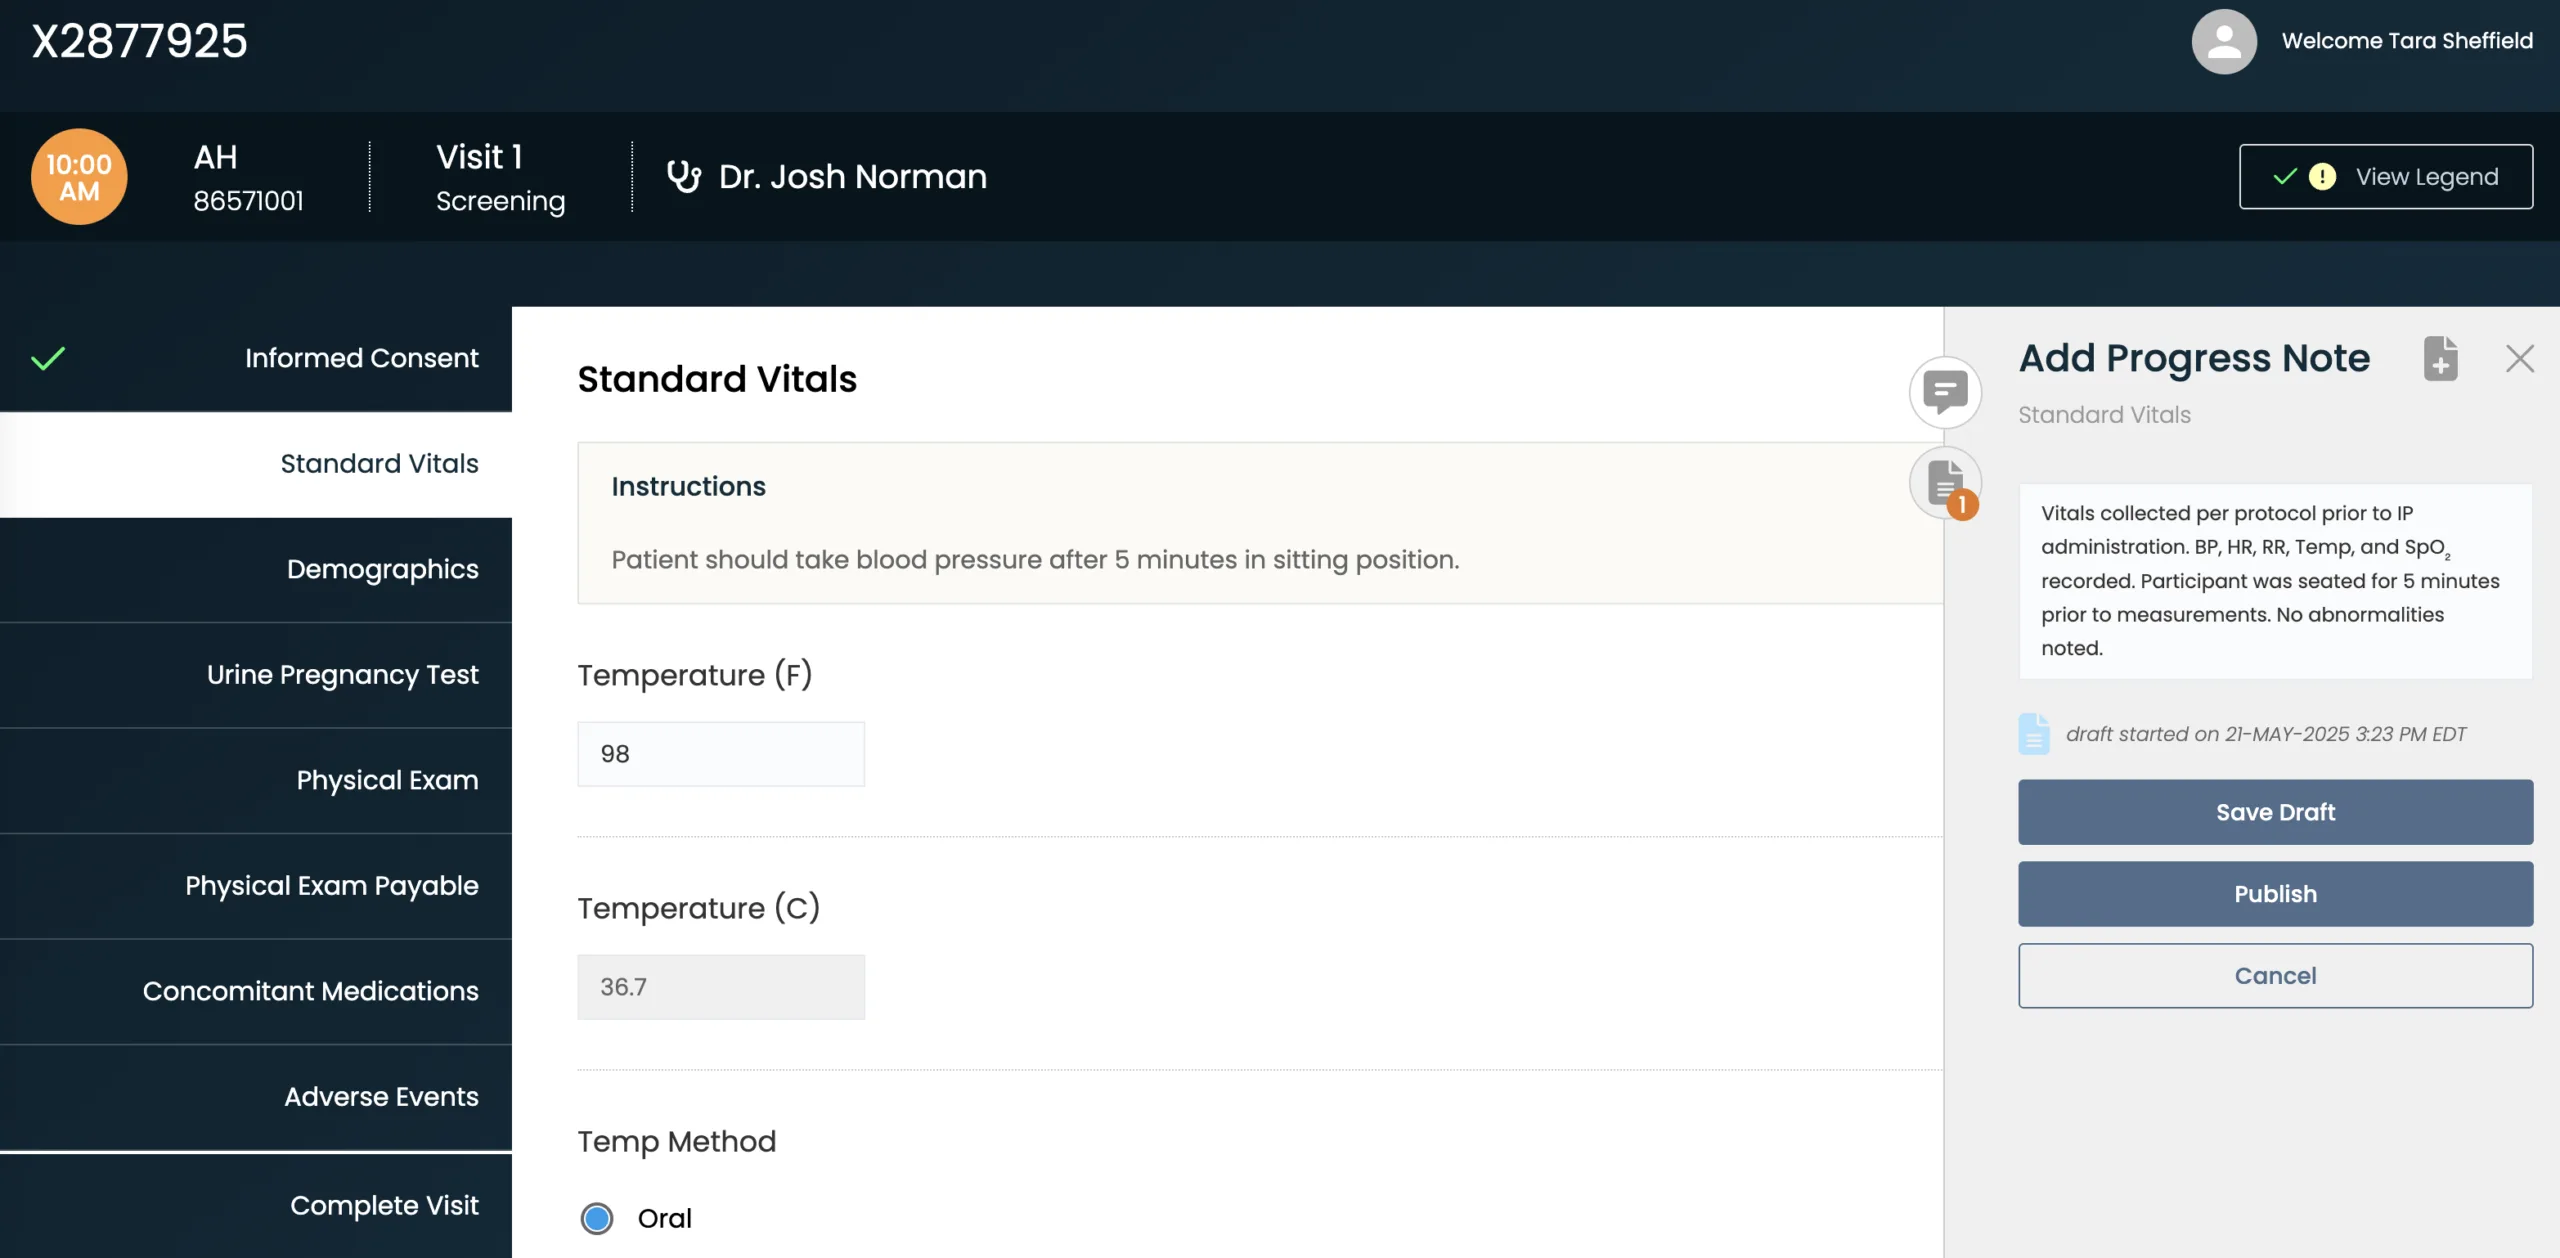
For over a decade, clinical research sites, site networks, and academic centers around the globe have used CRIO’s eSource to improve efficiency and guide protocol compliance, delivering higher quality data and fewer protocol deviations.
Built for Sites, Better for Trials
CRIO is the leading eSource in clinical trials, delivering 40% higher enrollment, 40% faster startup, and 40% fewer protocol deviations.
eSource Platform
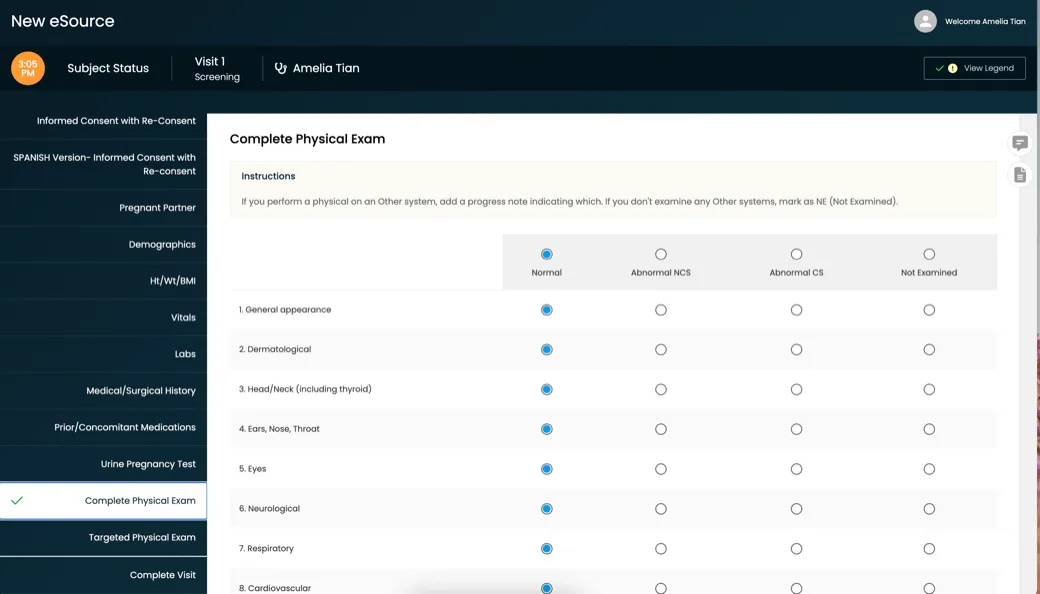
Created by a team of clinical research experts to help sites manage their study protocols from start to finish, our platform helps sites compliantly and efficiently capture source data.
EDC Integration
Integrate Central eSource with other third-party EDC systems or use CRIO’s Reviewer EDC for full, native integration.
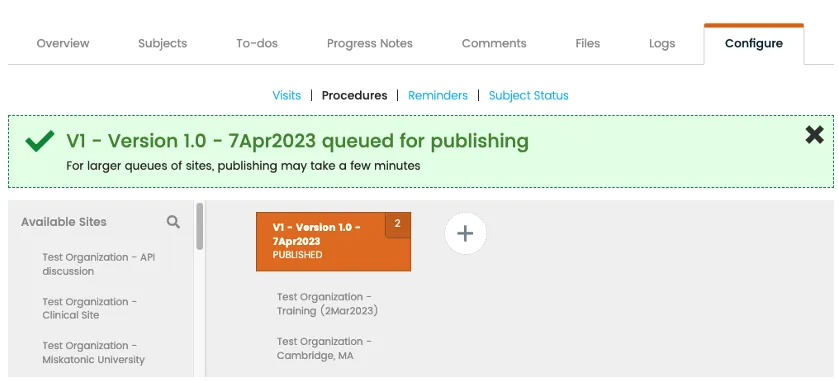
Publishing
Centrally create, manage, and publish eSource templates across multiple sites.
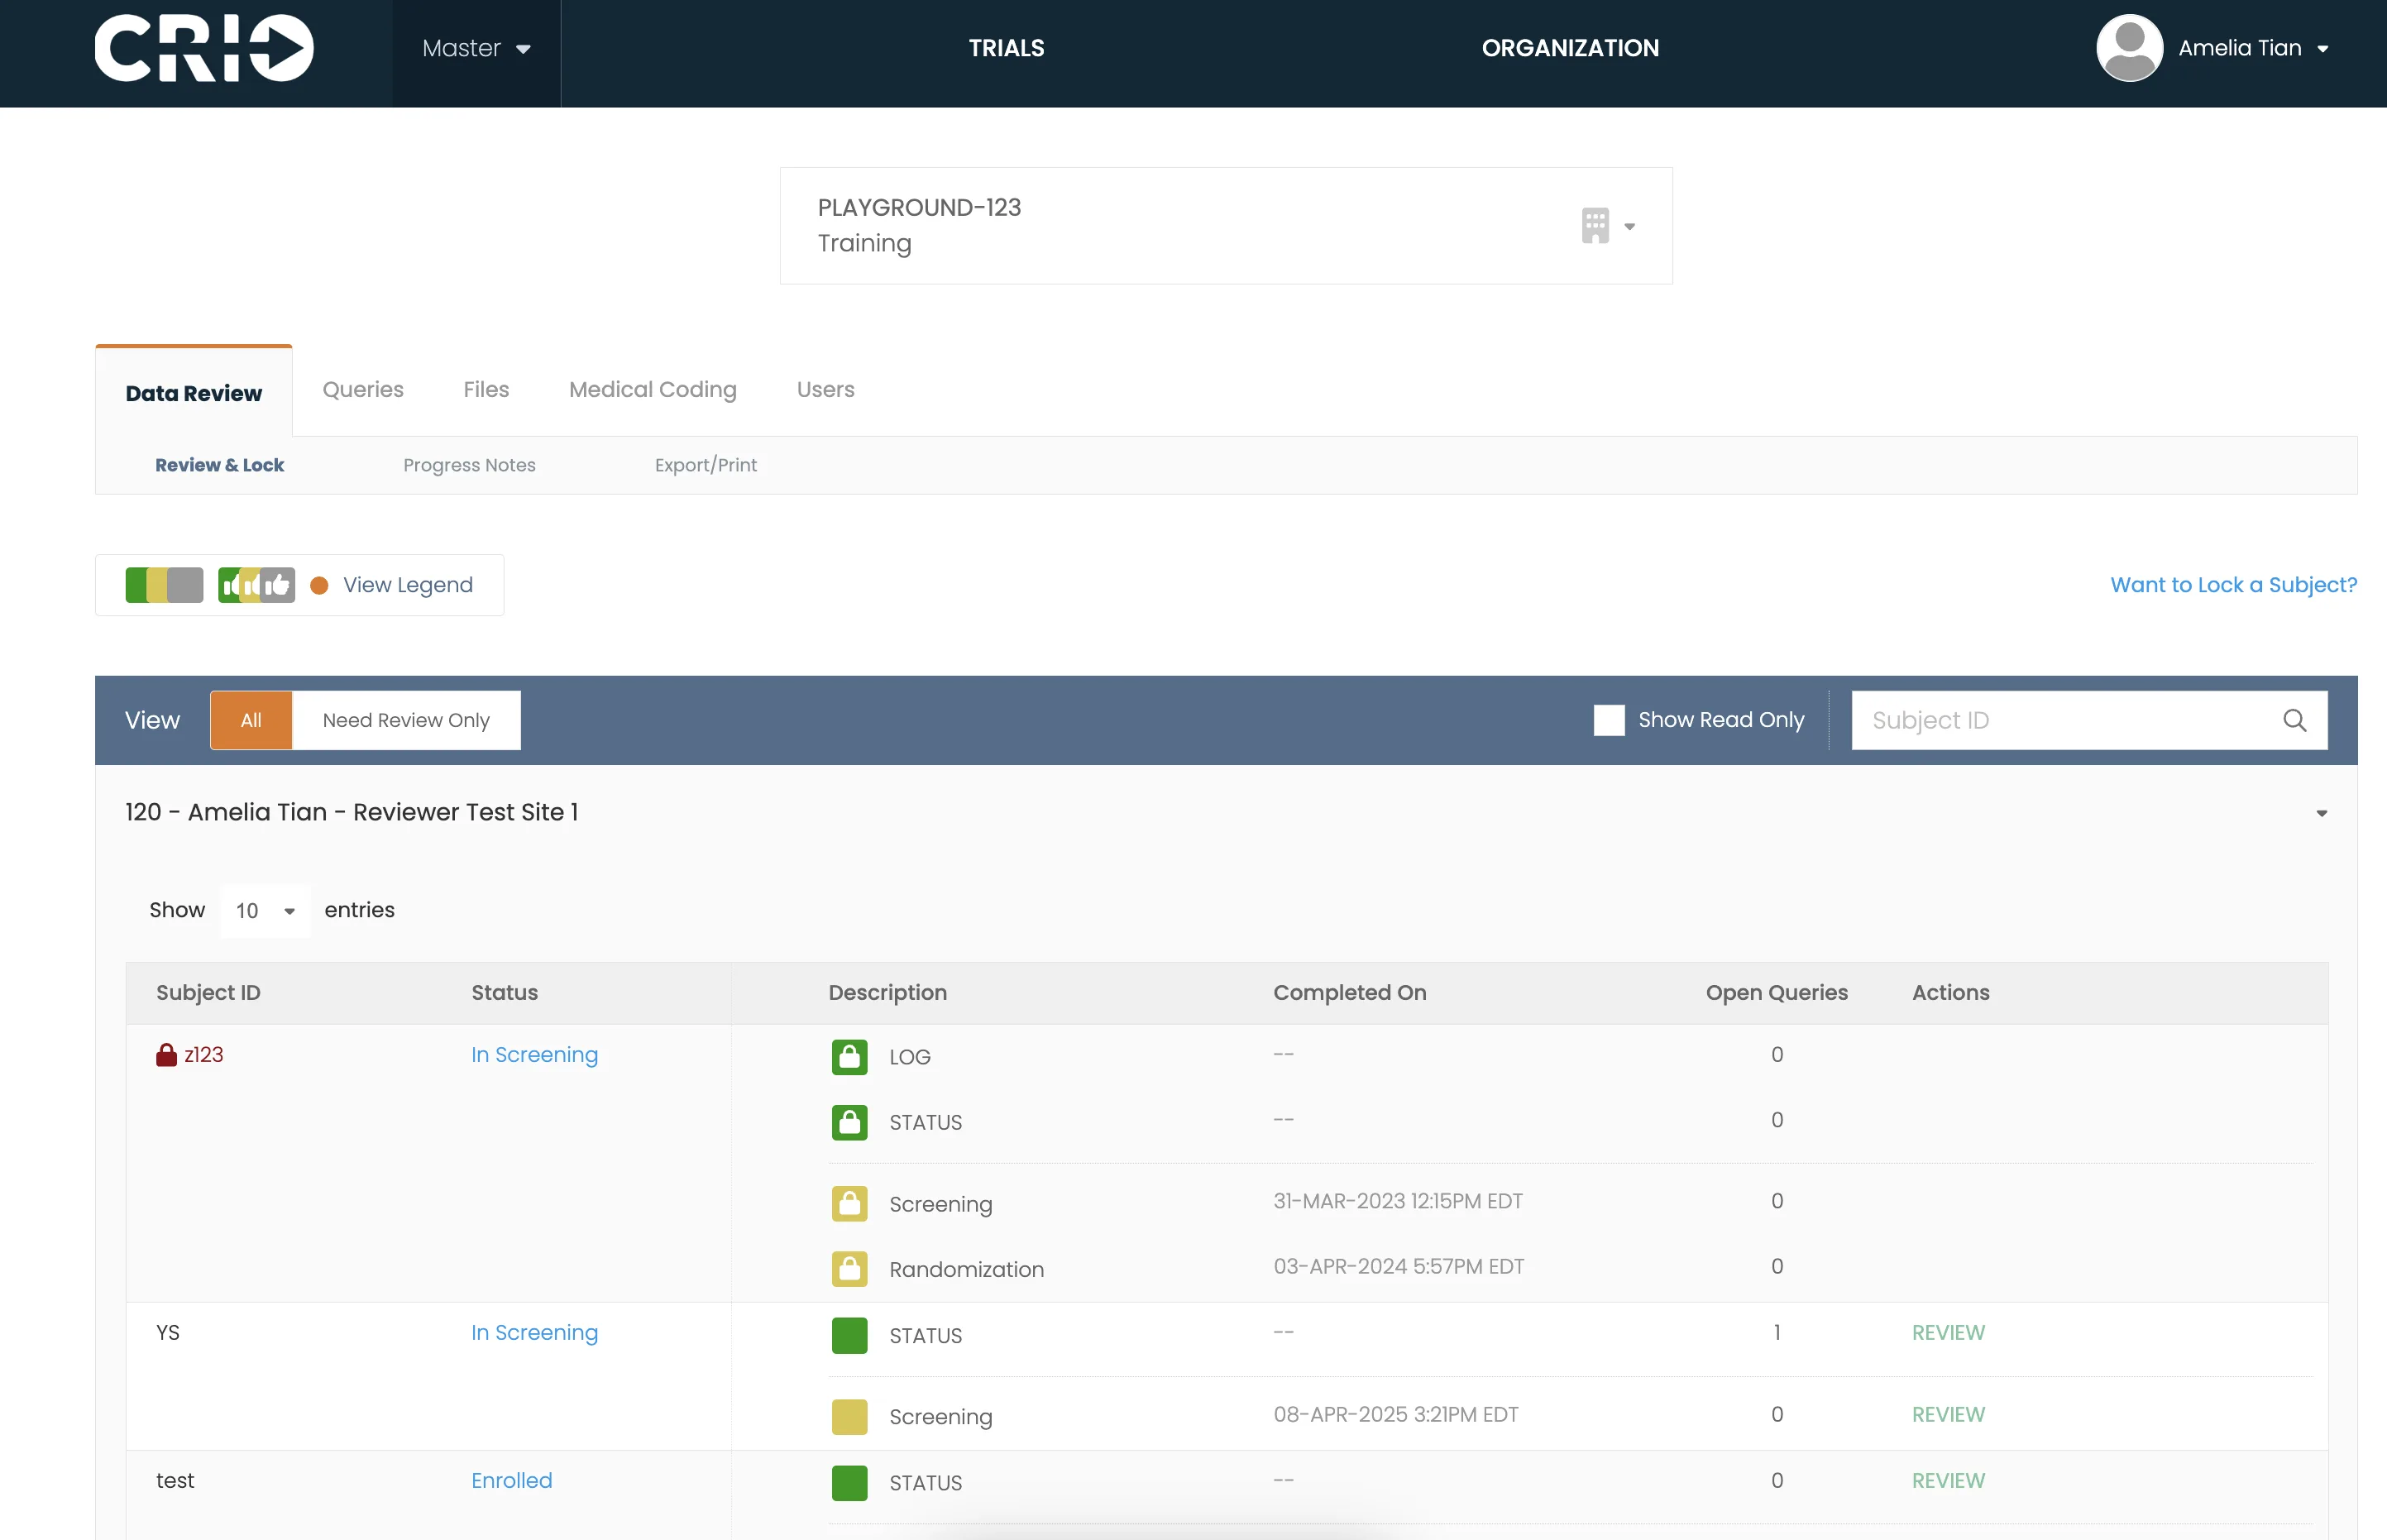
Reporting
CRIO offers a comprehensive suite of standard reports, a flexible tool for creating reports within the CRIO platform, a custom report development service, and direct data access that allows clients to use their own business intelligence tools.
Interoperable eSource for Clinical Trials
Our eSource system is fully integrated with our Site CTMS, eRegulatory, and eConsent solutions. It also has an open API, allowing for integration with other technology providers.