Leverage Site eSource Technology to Improve Trial Quality
With most eSource solutions, clinical trial sites create their own source templates from complex protocols and eCRF guidelines, use the templates to collect source data in disparate paper and electronic systems, and then manually transcribe the data into the electronic data capture system (EDC) — inevitably leading to delays and poor data quality. How can you get immediate visibility and better data without adding more work for your sites? There’s a Central eSource system that does it all. It’s clearly CRIO.
Find out how your next trial can benefit from CRIO Central eSource.
Automate Data Flow From eSource to EDC
With the CRIO Central eSource system, you develop a central source template and publish it to your sites, who can then configure the template to comply with local requirements while leaving core data fields intact. This unique process reduces site burden, accelerates startup, and standardizes data collection to improve overall quality.
By reducing administrative work and preventing errors, CRIO Central eSource delivers 40% higher enrollment, 40% faster time to EDC entry, 20% fewer protocol deviations, and a 90% increase in monitoring productivity.
The CRIO Central eSource System vs. Everyone Else
Without CRIO Central eSource
Different protocol interpretations lead to variations in source templates and data collection
Sites must create the whole source template, slowing study startup
Manual EDC entry causes errors, delays, and extra work for sites and requires sponsors and CROs to perform source data verification (SDV)
A mix of source data collection mechanisms with varying accessibility for sponsors and CROs
With CRIO Central eSource
One centralized template ensures key safety and endpoint data are captured the same way across all sites
Templates are standardized with key data points but can still be configured by sites to fit their processes
Pre-mapped eSource variables feed data directly into the EDC
Sponsors and CROs have real time, fully remote access to source data across all sites
Got a question about how Central eSource can optimize your study?
Central eSource Features
Central eSource allows sponsors and CROs to benefit from the technology sites are already using.
eSource to EDC Data Flow
Eliminate manual transcription and SDV with integration to Reviewer EDC — our native EDC system — or a third-party EDC system.


Reporting
CRIO offers a comprehensive suite of standard reports, a flexible tool for creating reports within the CRIO platform, a custom report development service, and direct data access that allows you to use your own business intelligence tools.
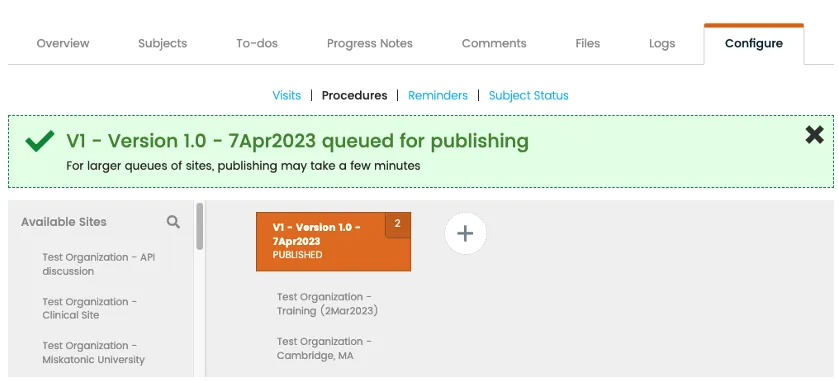
Publishing
Centrally create, manage, and publish eSource templates across multiple sites.
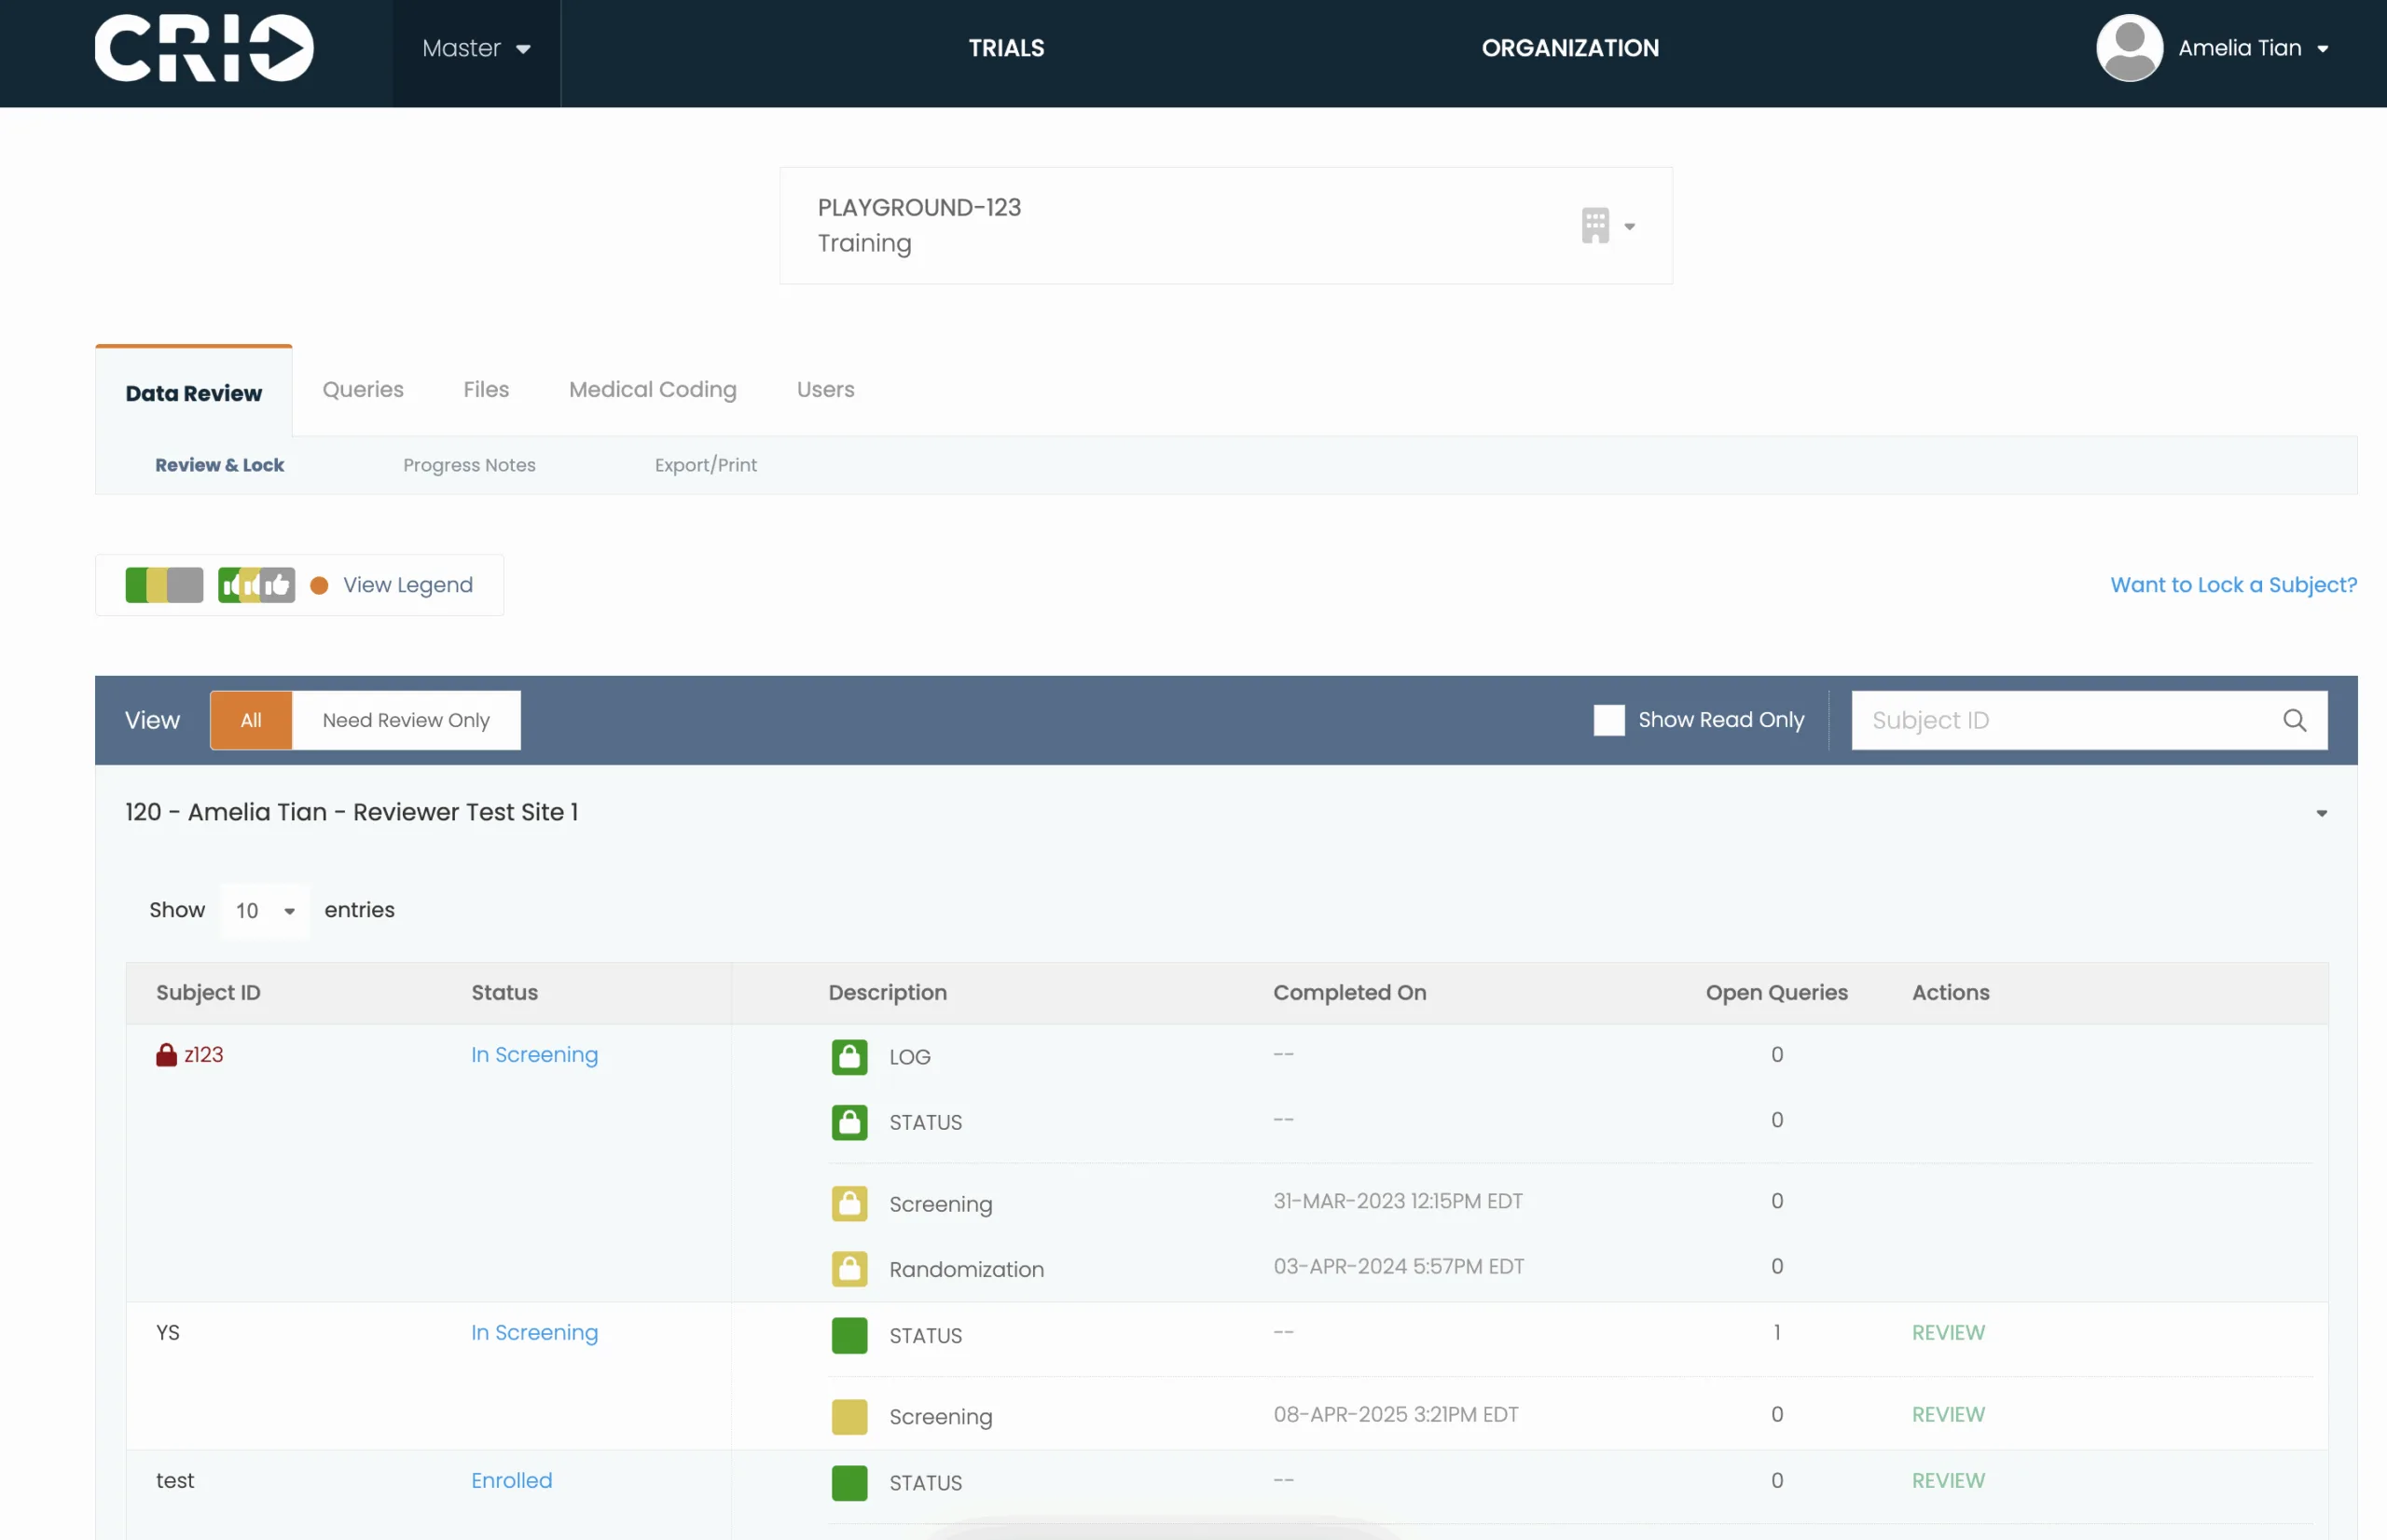
Remote Monitoring
Dual database architecture allows real time data access for sponsors and CROs while protecting PHI.
Customer Service
Easily onboard and train participating sites with our site enablement team and keep studies moving after startup with high-touch customer service, 24/7 live chat, and dedicated resources.


The Sites Have Spoken
CRIO is the eSource system of choice for sites. Why not make the most of it with Central eSource?