You want to scale your network and revenue, but ensuring consistency across multiple sites is a logistical nightmare. Luckily, there’s a proven clinical research software platform that easily standardizes data collection and operations. It’s clearly CRIO.  

Screenshot of the CRIO web app “My Dashboard” page. At the top is the CRIO logo, a home icon, and main navigation links (Studies, Subjects, Schedule, Tasks, Files, Organization, Recruitment, Financials, eReg, Reports) on a dark blue bar. Below, a white page header reads “My Dashboard.” Underneath is a tabbed panel with “Visits to Complete” selected (other tabs: Visits to Sign Off; Queued Jobs).

Left panel (Visits):

Today’s Remaining Visits (1): Date “18 Apr” in gray, a brown 7:30 AM circle labeled “Subject Status • New eSource | Visit 3 – Treatment” with status “READY” in green. A toggle at top right of this panel shows “Show visits for ME” highlighted (option “ALL” next to it).

Today’s Processed Visits (2): Date “18 Apr,” then two entries: 7:00 AM Subject Status – Visit 1 Screening (status “PARTIALLY COMPLETE” in yellow), and 10:00 AM Subject Status – Visit 2 Baseline (also “PARTIALLY COMPLETE”). The background of this section is a light gray.

Overdue Visits (6): Date “17 Mar,” one entry visible: 1:30 PM Custom Calendar cc • New eSource | Visit 1 – Screening in “Exam Room 4,” status “NOT YET STARTED” in red on a pale pink background.

Right sidebar (Tasks):

A pink box titled “My Tasks” listing: 1 Unresolved Comment, 4 Draft Progress Notes, 4 Assigned Documents, 10 Owned Documents—each with a small matching icon.

Below, a gray box titled “Prime Study Tasks” showing 1 Unresolved Comment and 7 Draft Progress Notes.

Beneath that, a line reading “3 Incoming Documents” in plain text.

At bottom right of the screen is a circular blue help icon with a question-mark.
  • 40% fewer protocol deviations

  • 70% lower audit risk

  • 40% higher enrollment
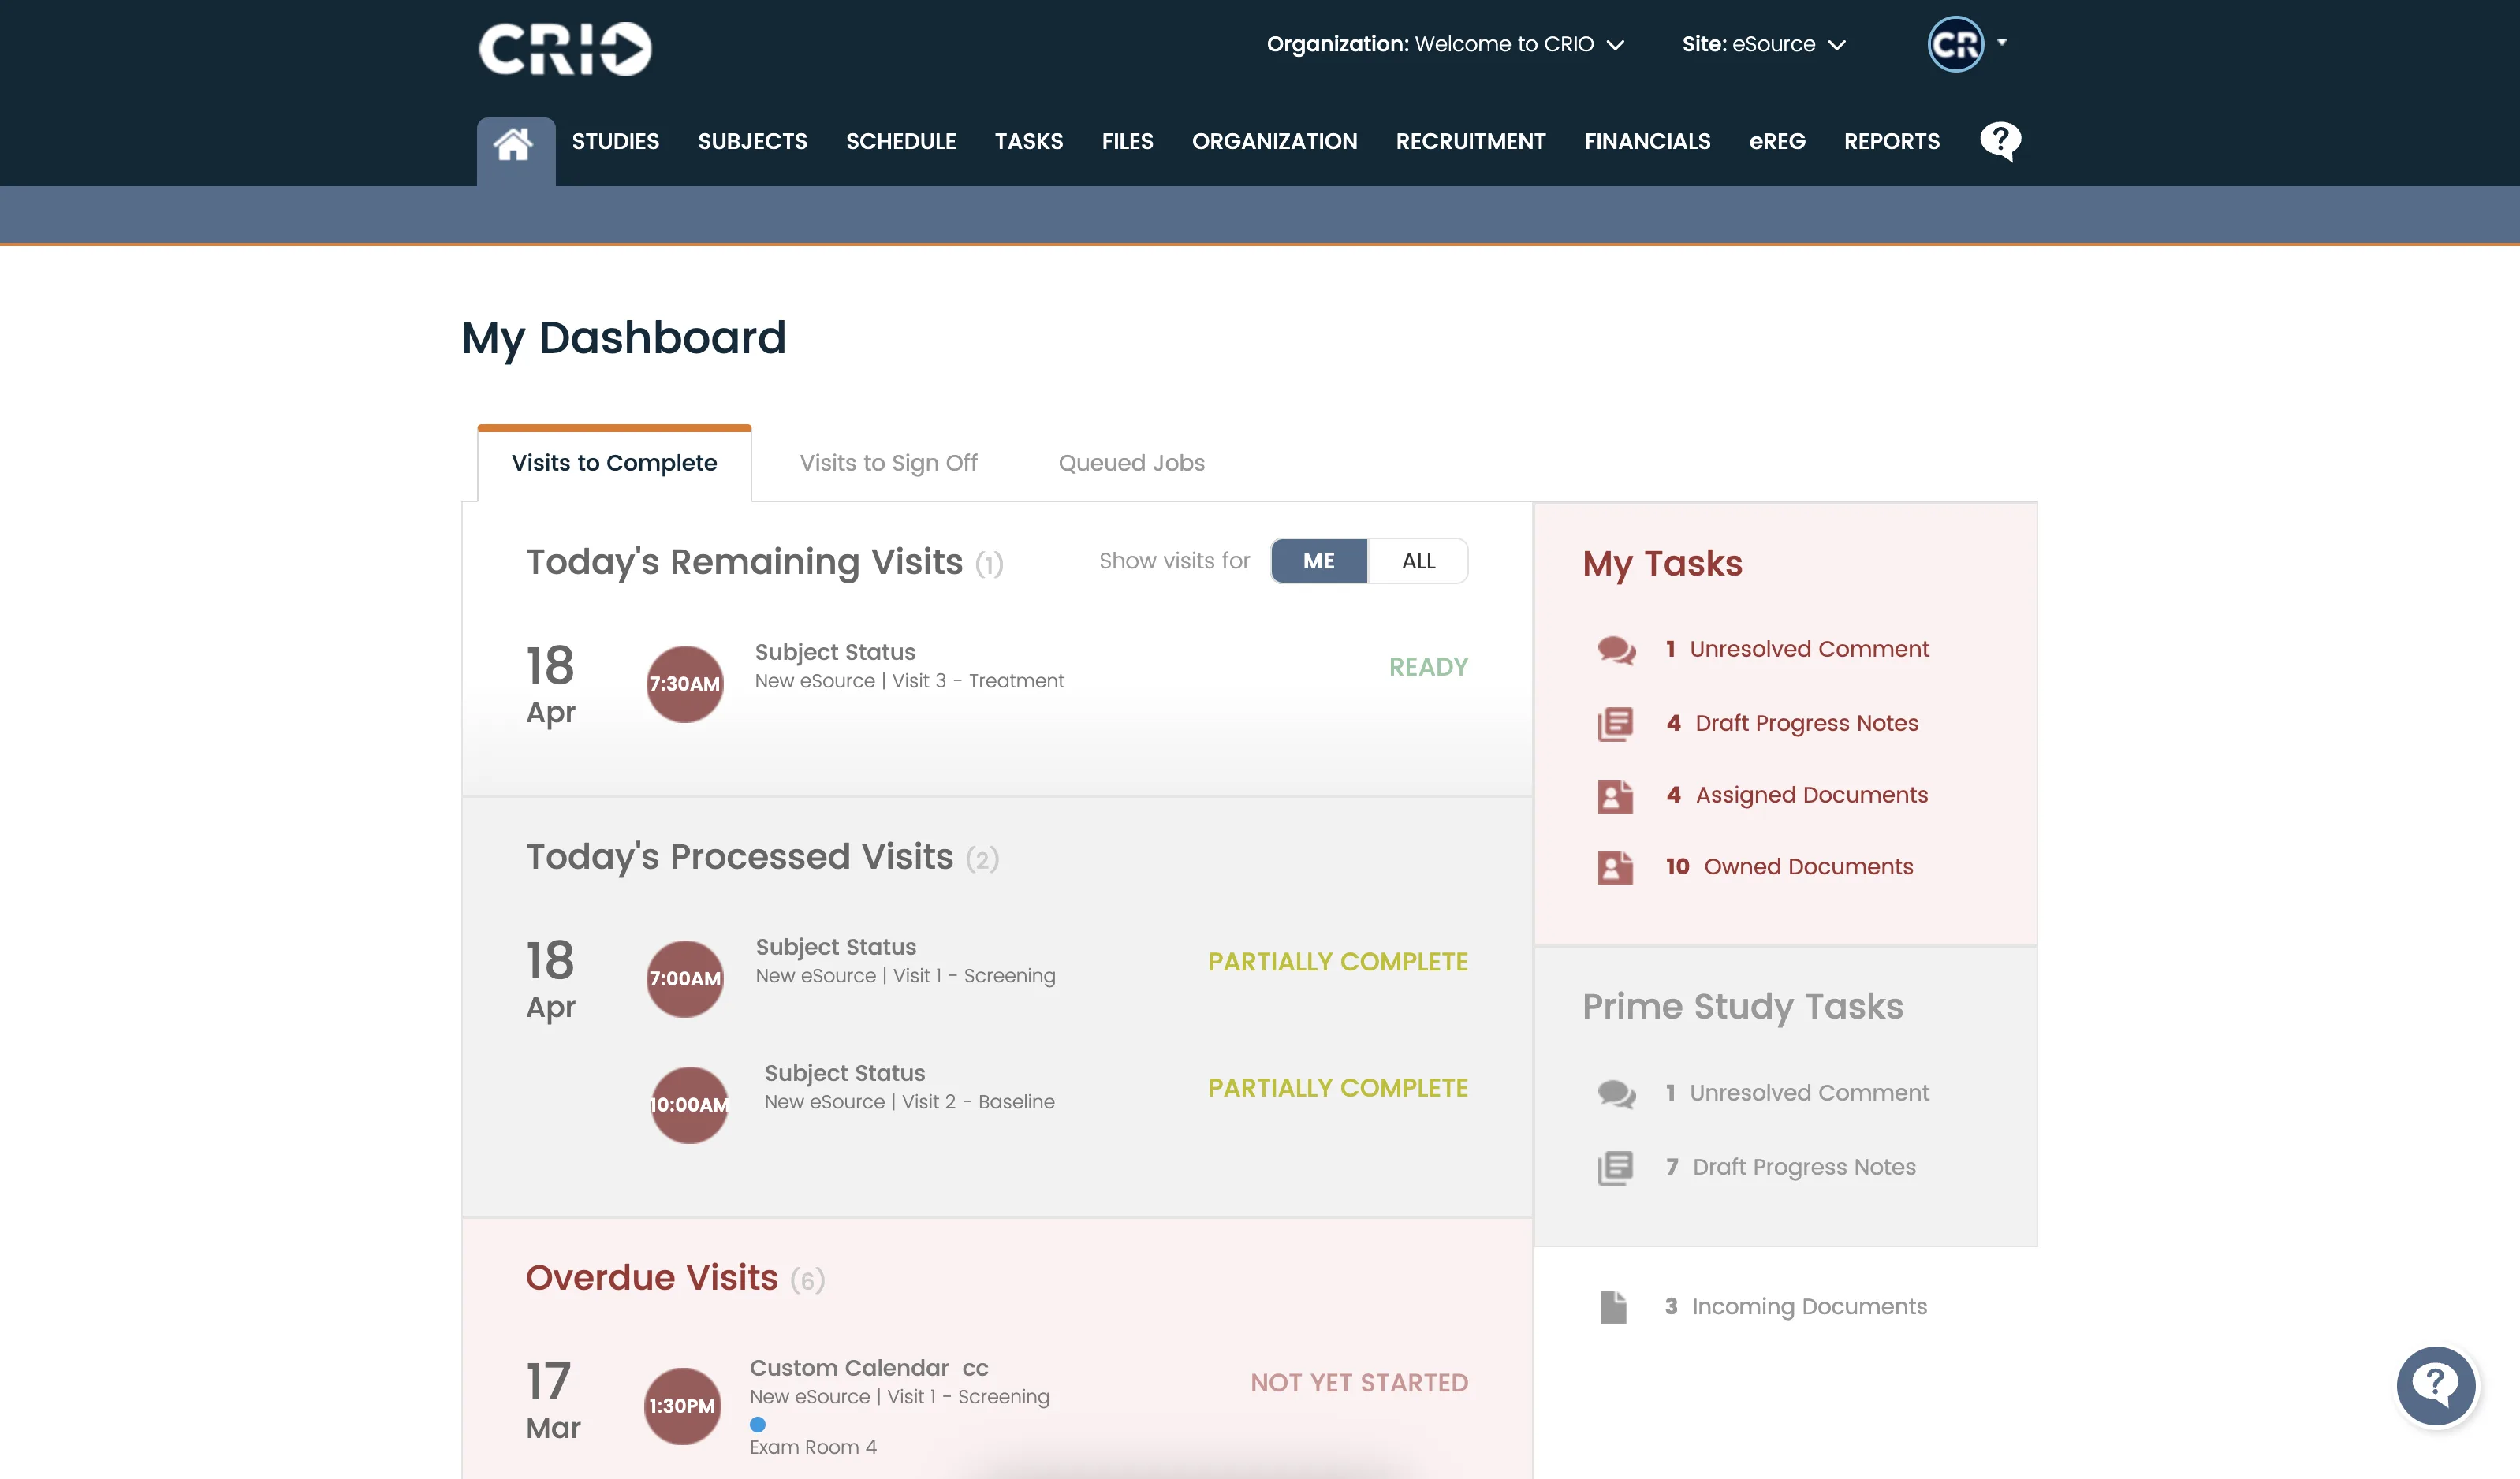
A powerfully simple clinical research software platform, CRIO has the features you need to take your site network to the next level.  

Save Time and Money While Enhancing Quality

  • Centralize patient recruitment, study design, regulatory compliance, financial management, and electronic data capture (EDC) entry 
  • Give your coordinator teams more time to focus on patient recruitment and retention 
  • Use our open application programming interface (API) to send in recruiting leads, schedule directly on site calendars, and integrate other solutions 
  • Leverage our custom reporting and other data access options to get real-time insights for continuous improvement and decision-making 
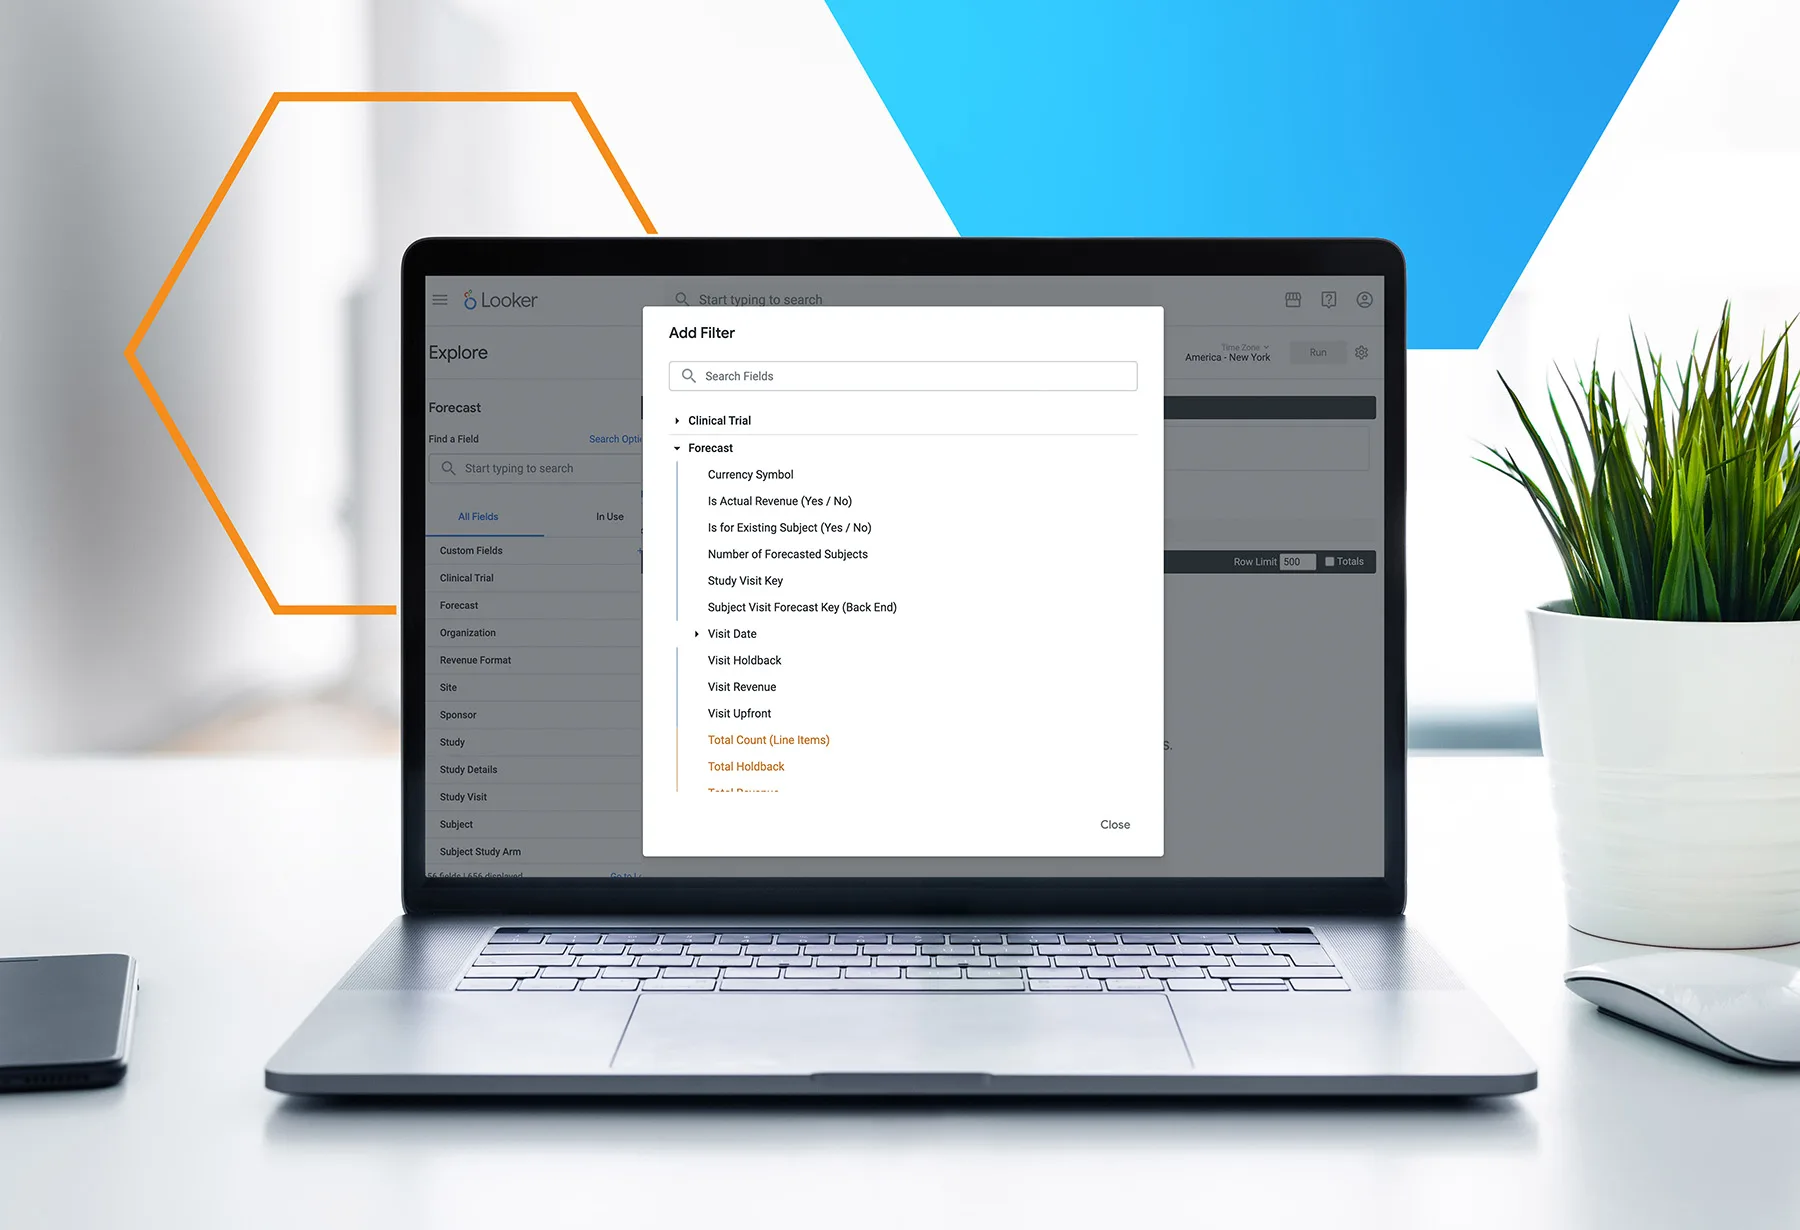
A photograph of a person’s hands poised over a laptop keyboard, the screen displaying the CRIO web application “My Dashboard” page. The top navigation bar shows the CRIO logo at left, menu items (Studies, Subjects, Schedule, Tasks, Files, Organization, Recruitment, Financials, eReg, Reports), and a user avatar at right. Below, a white title bar reads “My Dashboard.” The main panel is divided into three cards under a “Visits to Complete” tab:

Today’s Remaining Visits (1):
– “18 Apr” date label with a red 7:30 AM time badge, “Subject vSource | Visit 3 – Treatment,” status “READY.”

Today’s Processed Visits (2):
– “18 Apr” with a maroon 7:00 AM badge for “Subject vSource | Visit 1 – Screening,” “PARTIALLY COMPLETE” in yellow-green.
– A second entry “18 Apr” with a maroon 7:00 AM badge for “Subject vSource | Visit 2 – Baseline,” “PARTIALLY COMPLETE.”

Overdue Visits (6):
– “17 Mar” with a pink 1:30 PM badge for “Custom Calendar cc | New eSource | Visit 1 – Screening,” status “NOT YET STARTED.”

On the right sidebar titled “My Tasks,” pink and gray boxes show counts for “Unresolved Comment,” “Draft Progress Notes,” “Assigned Documents,” and “Owned Documents.” Beneath, “Prime Study Tasks” lists similar items. The overall scene is set on a wooden desk with the background softly out of focus.

A photo of a laptop on a white desk displaying the Looker “Explore” interface with a modal titled “Add Filter” centered on the screen. Behind the modal you can just make out the Looker sidebar showing “Explore” and the “Forecast” view. The modal contains:

A search box at the top labeled “Search Fields.”

A collapsible “Clinical Trial” category (collapsed).

An expanded “Forecast” category listing fields such as “Currency Symbol,” “Is Actual Revenue (Yes / No),” “Is for Existing Subject (Yes / No),” “Number of Forecasted Subjects,” “Study Visit Key,” and “Subject Visit Forecast Key (Back End).”

A subcategory “Visit Date” (collapsed), and below that fields “Visit Holdback,” “Visit Revenue,” “Visit Upfront,” and summary measures in orange text: “Total Count (Line Items),” “Total Holdback,” and “Total Revenue.”

A “Close” button at the bottom right of the modal.

The laptop sits in a bright, minimalist environment with an orange hexagon graphic overlay at top left and a green potted plant and mouse to the right.

Enhance Reporting

  • Design and run hundreds of reports 
  • Use your own business intelligence tool to query your data directly  
  • Capture all your revenue, costs, and patient stipend obligations in real time, as your team completes eSource, by integrating budgets directly into the eSource template 
  • Track all changes in revenue at the change item level, enabling consistent monthly revenue closing consistent with GAAP reporting obligations 

Get Started Quickly and Keep Going Easily

  • Empower staff at all levels with an interactive, AI-powered CRIO help center  
  • Get streamlined implementation and data migration support from a single point of contact in our dedicated customer experience team  
A laptop on a wooden desk showing the CRIO web app’s Data Collection “Configure” view, with the “Procedures” tab open: a table of visit stages (Screening, Randomization, Day 1, Day 2, Day 3, EoT) each marked with green check-marks or gray circles to indicate completion. Docked on the right edge of the screen is a live chat widget titled “Welcome to CRIO Support,” showing “Juno • 11:07 AM Chat queued…” and a “Chat now” button, with Home and Chat icons below and “Powered by LiveChat” at the bottom.

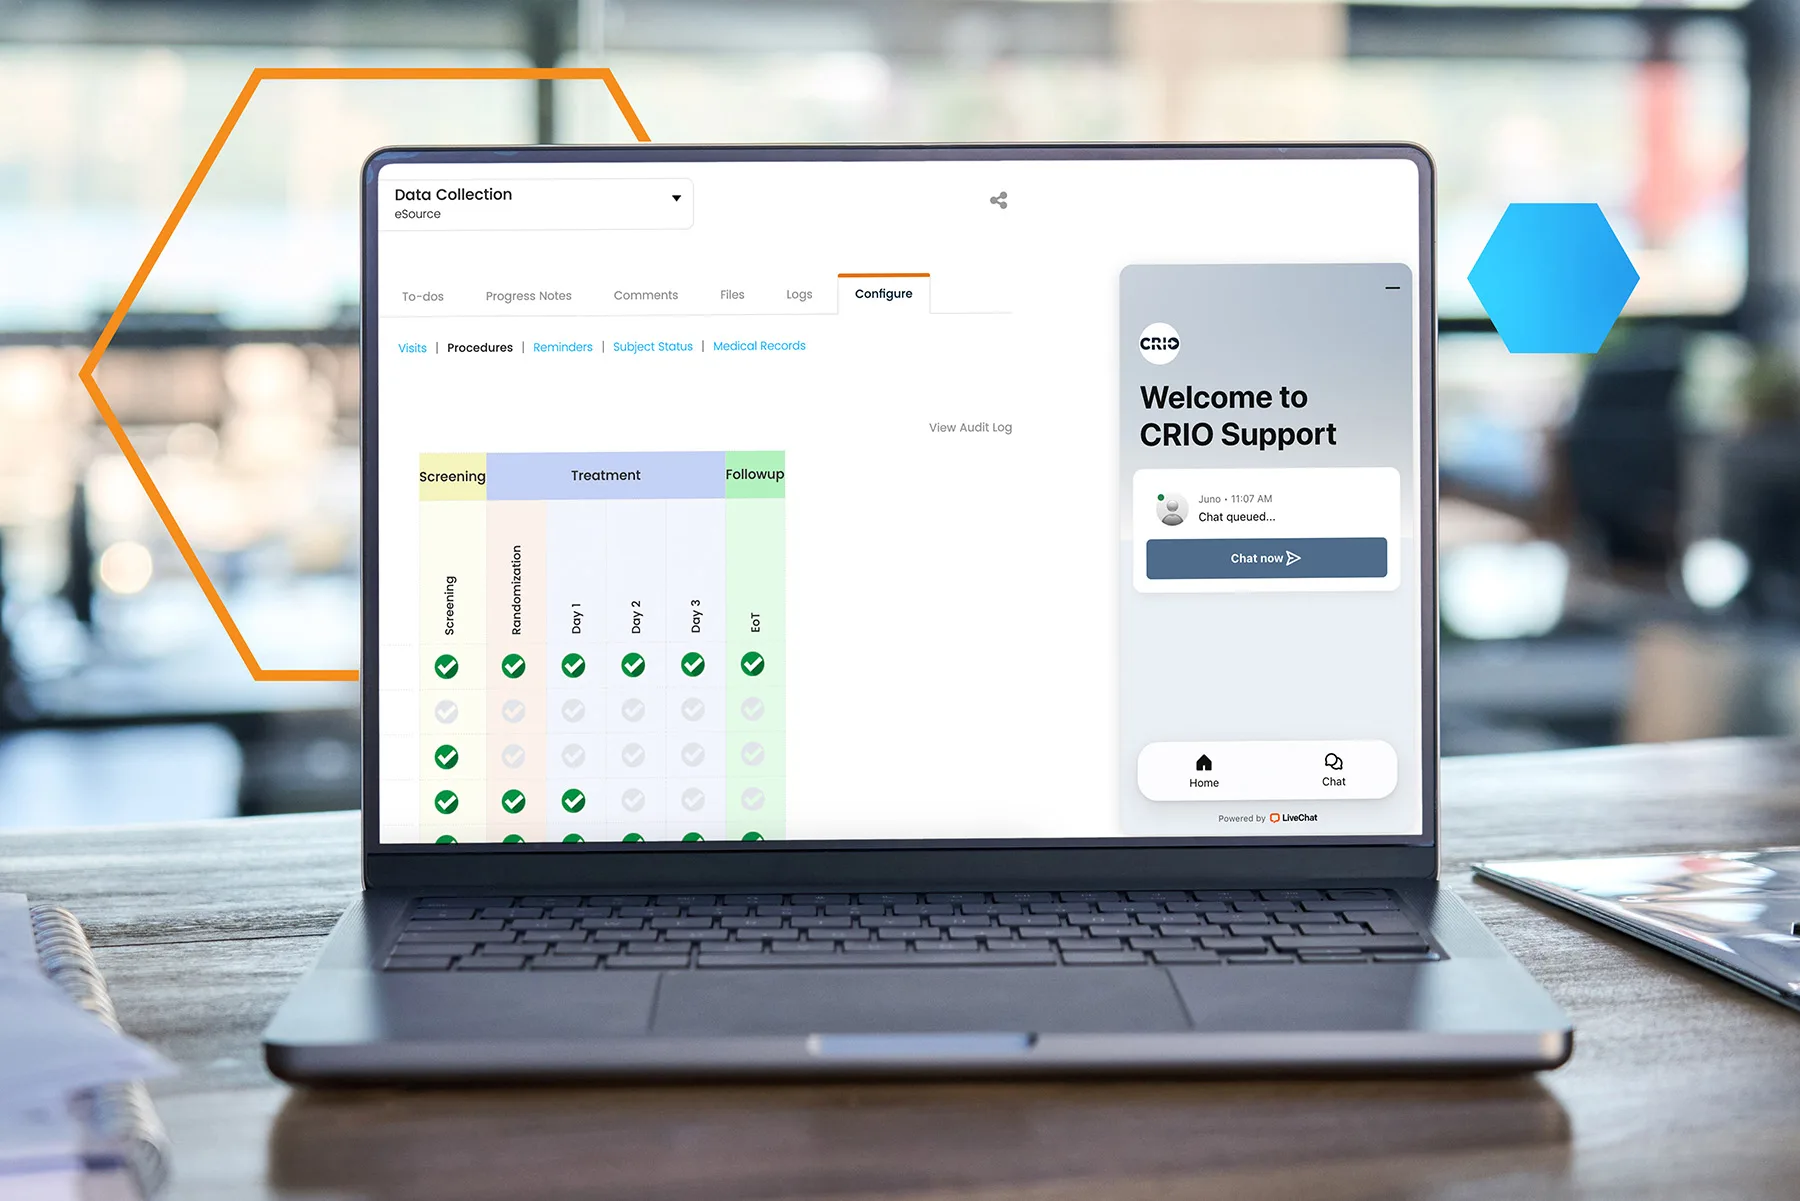
​CRIO’s live, 24/7 customer support chat has a 97% satisfaction rating.

Is it possible to reduce data errors, enhance patient safety, and simplify PI oversight on thousands of studies across 9 different sites? With CRIO, it’s not just possible — it’s easy. 

Find the Best Clinical Research Software Tools for Your Site Network

Site CTMS

Simplify and accelerate operations

Patient Stipends

Issue and load patient stipend cards

Medical Record API

Request and review subject medical records  

A healthcare professional in blue scrubs typing on a laptop, with a stethoscope around their neck, sitting at a wooden desk.

We literally wrote the book on using clinical research software to enhance site network consolidation.  

The Consolidation & Reinvention of Site Networks 

SiteBridge Research

Get the eSource software you need and watch your business succeed.

Schedule a Demo