
The clinical research ecosystem has experienced a surge in protocol complexity that is imposing unprecedented operational burden on clinical research sites – specifically, it’s taxing their ability to build study design templates.
The Growing Challenge of Protocol Complexity
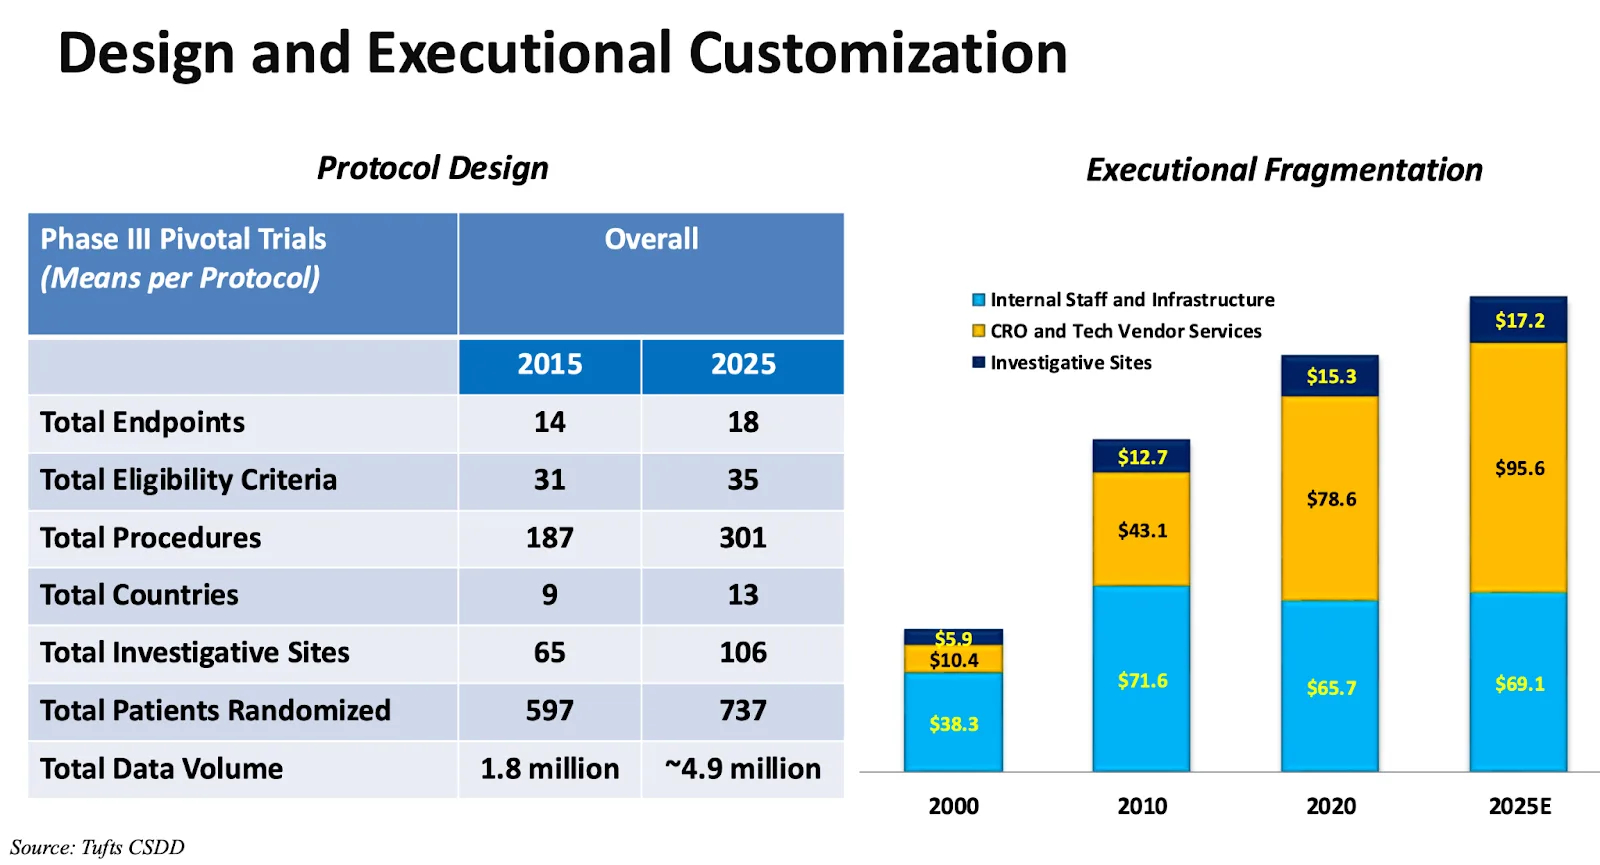
Tufts CSDD data recently highlighted how protocols continue to expand in scope1. Between 2015 and 2025, Phase III pivotal trials have seen:
- Procedures increase by more than 60% (from 187 to 301)
- Investigative sites grow by over 60% (from 65 to 106)
- Endpoints climb by 30% (from 14 to 18)
- Eligibility criteria rise by over 10% (from 31 to 35)
- Data volume nearly triple (from 1.8 million to 4.9 million datapoints)
Equally important, Tufts data shows that protocol amendments and deviations have also risen sharply. Most recently, the average phase 3 trial now averages 3.5 amendments per trial, up over 50% from 5 years prior, and the average trial has 296 protocol deviations, up almost threefold from 10 years prior.
Evidence from the Field: Study Design Services in Practice
All of this protocol complexity has substantial downstream effects on research sites, who must translate these protocols into study design templates – detailed worksheets with instructions and required data fields to guide protocol-compliant data capture. A blank source design template made on paper may be 5-15 pages per study visit; a study with 10 visits could easily compromise over 100 pages.
At CRIO, we have a dedicated Study Design service that has built over 1,600 electronic source templates on behalf of our clients. This gives us a unique lens into how protocol complexity manifests at the site level.
Using our internal scoring and quality control methodology, which accounts for factors like visits, arms, schemas, cycles, and eCRFs, we’ve tracked a steady rise in the study design complexity since 2018. Through 2024, the average number of procedures per study has grown by roughly 55% over the prior 6 years – a trend in line with Tufts’ 60% calculated increase over the prior 10 years.
In other words, two very different vantage points lead to the same reality: protocols are becoming more complex, and the burden is shifting downstream to sites.2
The Time Investment Behind Each Build
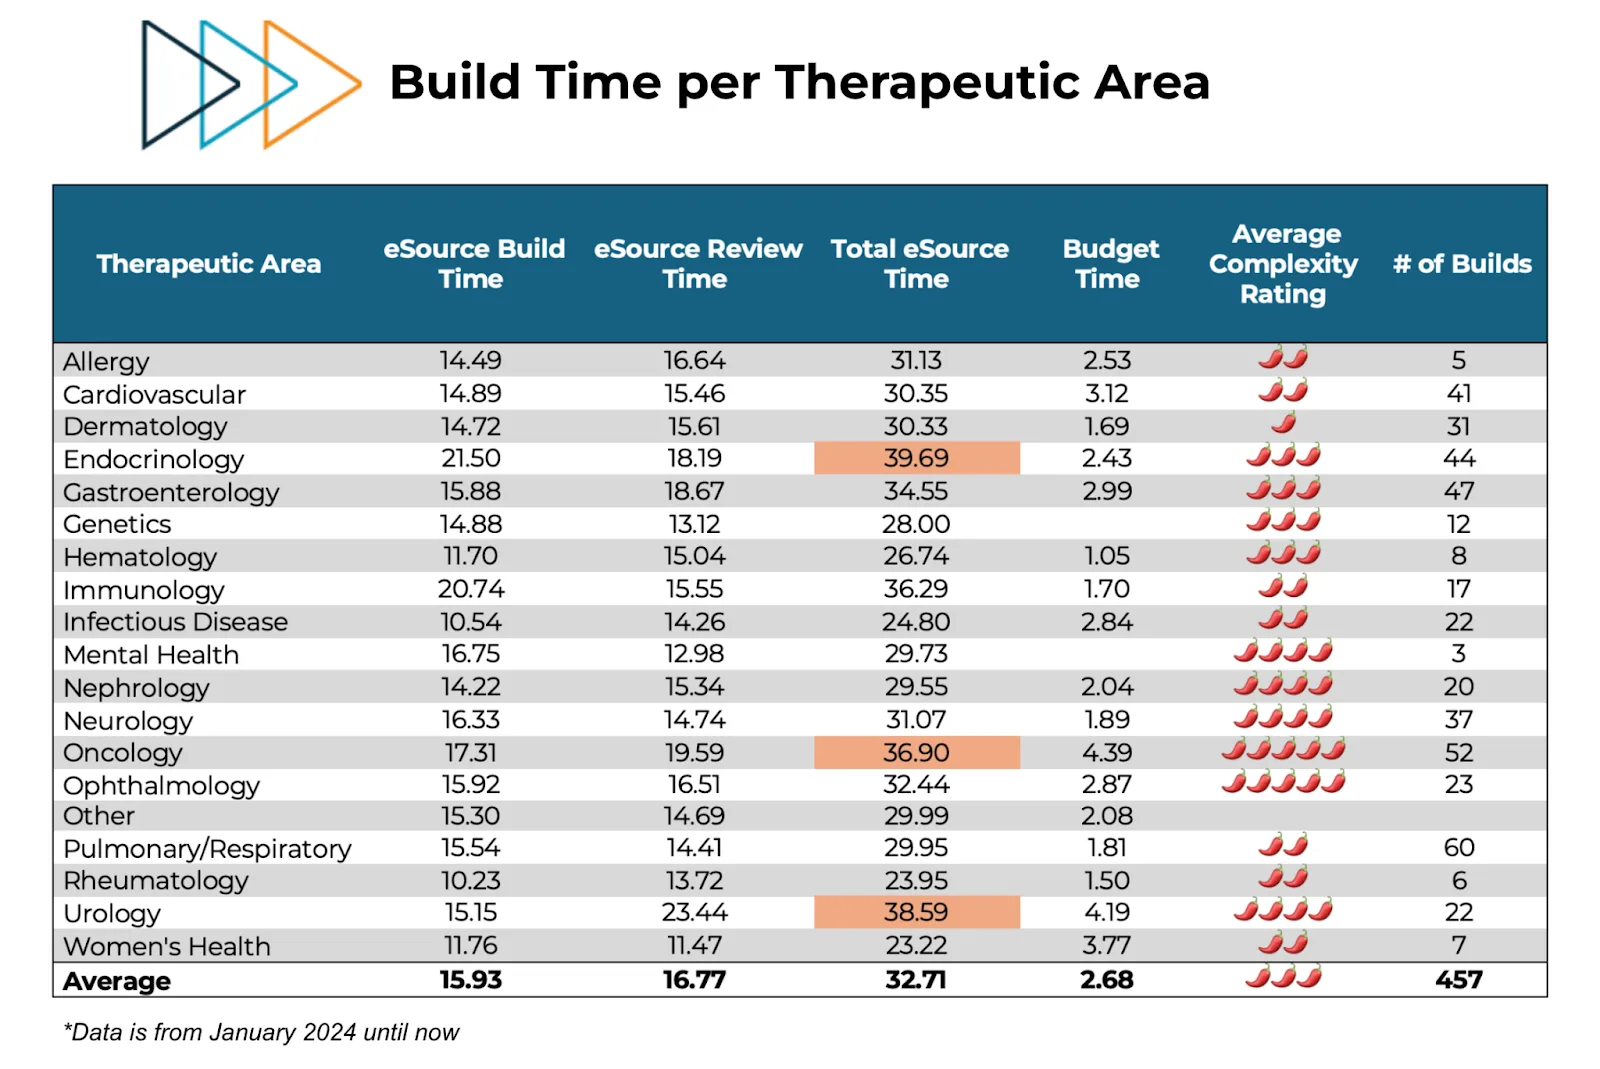
Complexity isn’t just an abstract concept; it has a measurable cost in time. Our study design teams take an average of 33 hours to build an eSource template for a single study (including adequate QC post-design). That’s nearly a full week of a coordinator’s time, time that could otherwise be spent on patient care and enrollment. This burden is fairly consistent across therapeutic areas – see CRIO’s average time metrics by TA, below.
And that’s just the billable time. The elapsed time is often longer, since busy coordinators have to fit this time into their workweek. As a result, enrollment frequently lags as sites struggle to finalize builds before they can see patients. In fact, CRIO’s experience is that when sites are provided with a pre-built, centrally designed eSource template, they enroll patients 30-45 days faster. This implies that the average site needs a month of elapsed time to complete the study build.
The Impact on Sites
The rising complexity translates into very tangible challenges for sites:
- Staff burden and burnout: Coordinators spend weeks buried in build work, delaying patient-facing tasks. Training new staff on increasingly complex builds compounds the challenge. Sites everywhere face a shortage of experienced research coordinators.
- Enrollment delays: As discussed above, the 30+ hours it takes to build a study leads to delays of 4-6 weeks before sites can start seeing patients.
- Increased protocol deviations and rework: More complex protocols make it difficult to design thorough study templates to guide coordinator work. The nearly 3x increase in protocol deviations per study is a clear and striking symptom.
- Audit and compliance risks: More amendments and deviations elevate audit findings and regulatory exposure. Each rework cycle creates opportunities for errors that compromise data integrity.
- Monitoring load: More errors and rework also elevate monitoring load. They’re the ones who have to perform “source data review”, ensuring accuracy and consistency of the data. Oftentimes, it takes two monitoring visit cycles – up to 12 weeks – to complete satisfactory reviews of source data.
Looking Ahead: A Need for Mature, Optimized Study Design
Protocol complexity will not reverse course. Personalized therapies, rare diseases, and oncology will continue to fuel rising demands. Without a drastic change in paradigm, the increasing burden of study design will continue to grind trials to a slowdown.
One paradigm shift is Central eSource. Instead of sites independently building their own source templates, and then manually re-entering source data into the EDC, sponsors can provide sites with a standardized, protocol-driven eSource template that builds in quality at point of capture. Because the source template is centrally designed, it can be mapped directly to the EDC, enabling integration at scale. Sites can then utilize CRIO’s unique EDC interface to send data directly into the EDC, eliminating manual entry.
Just as Central IRB standardized and streamlined the ICF process, Central eSource applies the same model to source design. Instead of 50 sites building 50 templates – which is literally one full year worth of labor at 30+ hours per site – a centralized design team builds one optimized template, in alignment with the EDC, that is then shared across sites. Just as with the ICF template, sites can then perform site-specific configuration as required. This balance creates a core standardized “kernel” required for EDC integration, surrounded by a flexible “shell” that supports local SOPs, institutional practices, and staff preferences.
The outcome is standardization across sites, higher data quality, and faster time to enrollment. Sponsors gain consistency, sites avoid having to do tedious and error-prone siloed builds, and both benefit from built-in quality at point of capture, faster time to EDC entry, and more flexible and risk-based remote monitoring. In short, Central eSource replaces dozens of site-built templates with a single high-quality design reducing risk, delays, and cost.
Conclusion
The data from Tufts and CRIO’ study design team paint a clear, consistent and unequivocal picture: protocols are getting more complex, and the burden on sites is growing at an unsustainable pace. Left unaddressed, this trend will continue to delay enrollments, increase protocol deviations, and strain already thin site resources.
We are hitting a crisis point. The industry must explore fresh solutions to keep trials viable. Central eSource is not only a proven model for alleviating site burden, it is also a way to give sites more influence, more flexibility, and more efficiency while sponsors benefit from cleaner and more standardized data.
1Source: Ken Getz, Tufts CSDD, Evolution Summit Keynote, May 2025
2Source: CRIO, Study Design History – Q1 2025